Wag Stats
Our primary goal was to activate pet owners in the vaccination conversation. In order to do so, we did some research on what was going on with pet owners. We found that the role of pets has evolved. During the pandemic, pet adoptions skyrocketed and people bonded more deeply with their pets. Millennials and Gen-Z are delaying life milestones, like having kids, so many think of their pets as children.
But despite pet owners spending money on CBD treats, cute outfits and birthday parties for their pets, we noticed what we called the “love-action gap.” Despite their best efforts to give their pets a great life, they aren’t necessarily making the connection that something might be missing in their pet care: vaccinations.
So to tap into this passion for pets, we created Wag Stats. We conducted a nation-wide survey with over 3,000 pet owners and pulled out the most interesting insights to bring pet parents in with fun, relatable pet stats and then hit them with information on the importance of vaccinating against lifestyle diseases.
In order to communicate our findings in a way that would resonate with pet owners, we created our North Star for Wag Stats – an infographic. Of course, with any good design, there is typically a system behind it. So the first step was to create a color palette system and type hierarchy to apply across all Wag Stats assets, starting with the infographic.
Agency / Colle McVoy for Elanco Pet Vaccines
Creative Director / Lee Hanson
Design Director / Diana Quenomoen
Designer / Carli Bruckmueller
Creative Director / Lee Hanson
Design Director / Diana Quenomoen
Designer / Carli Bruckmueller
Art Director / Anjali Ravi
Senior Editors / Abby Thompson, Cody Weigel
Copywriter / Bryce Boyle Hoban
Recognition:
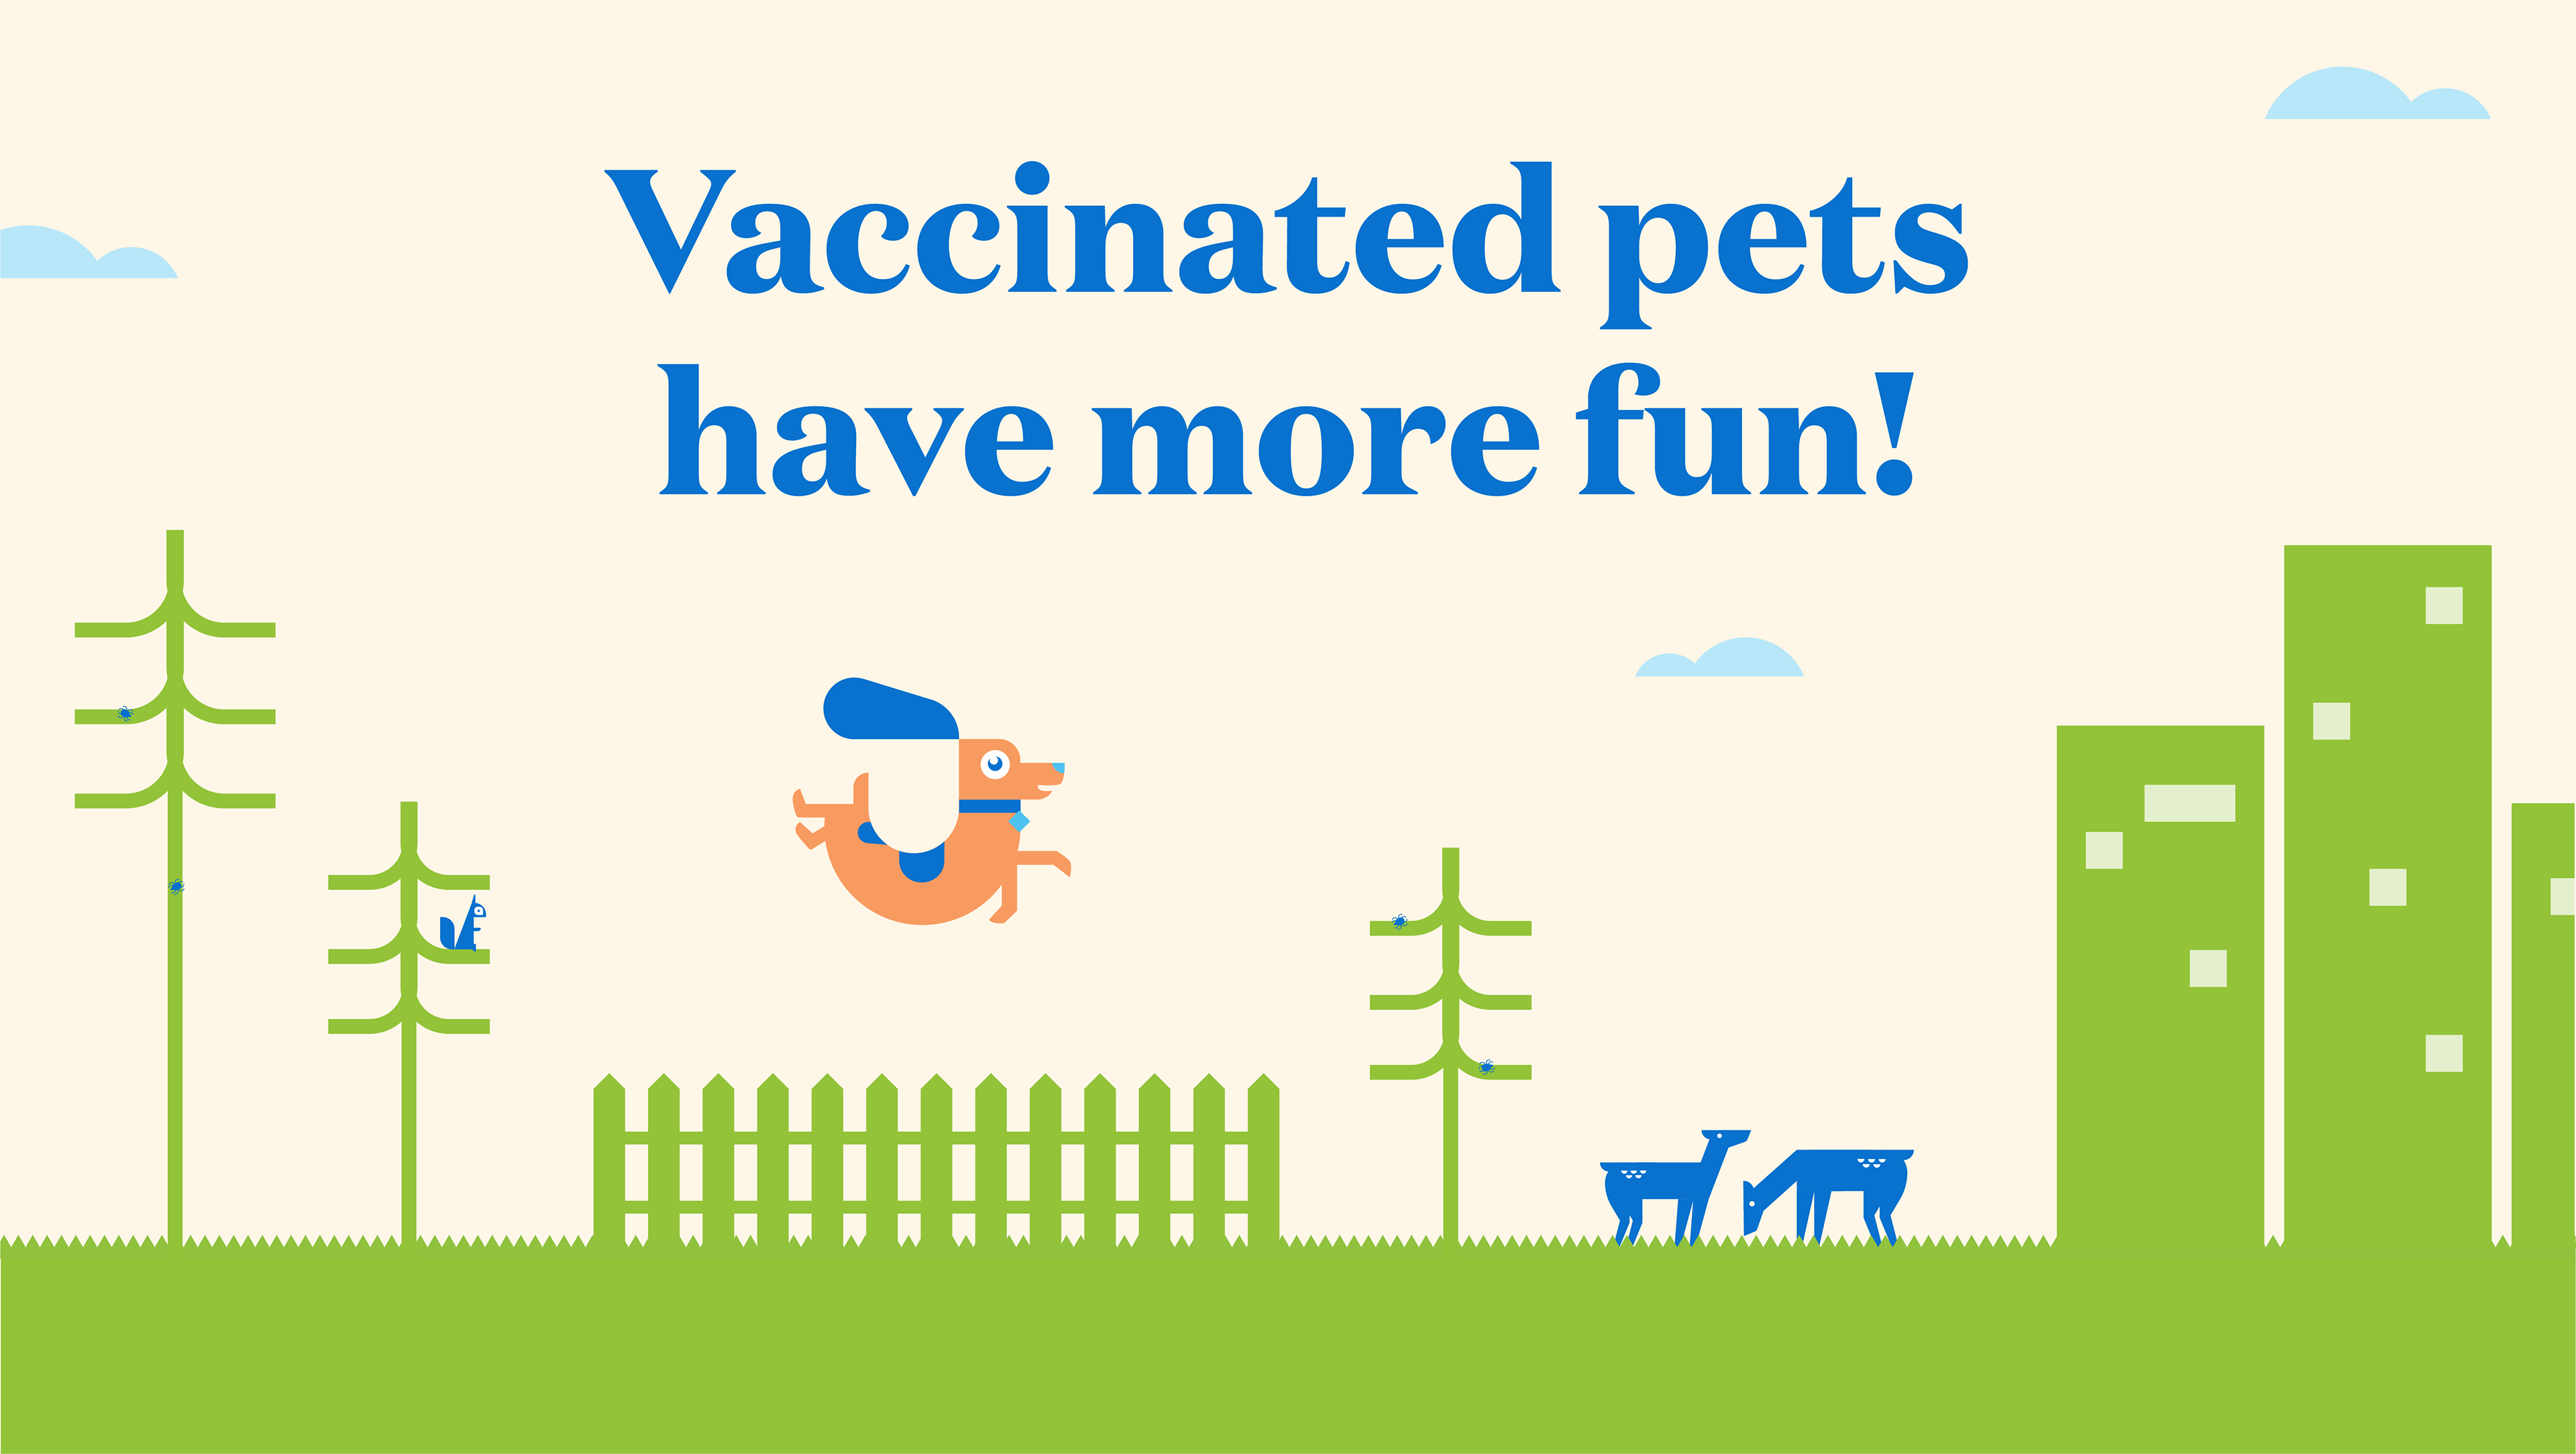
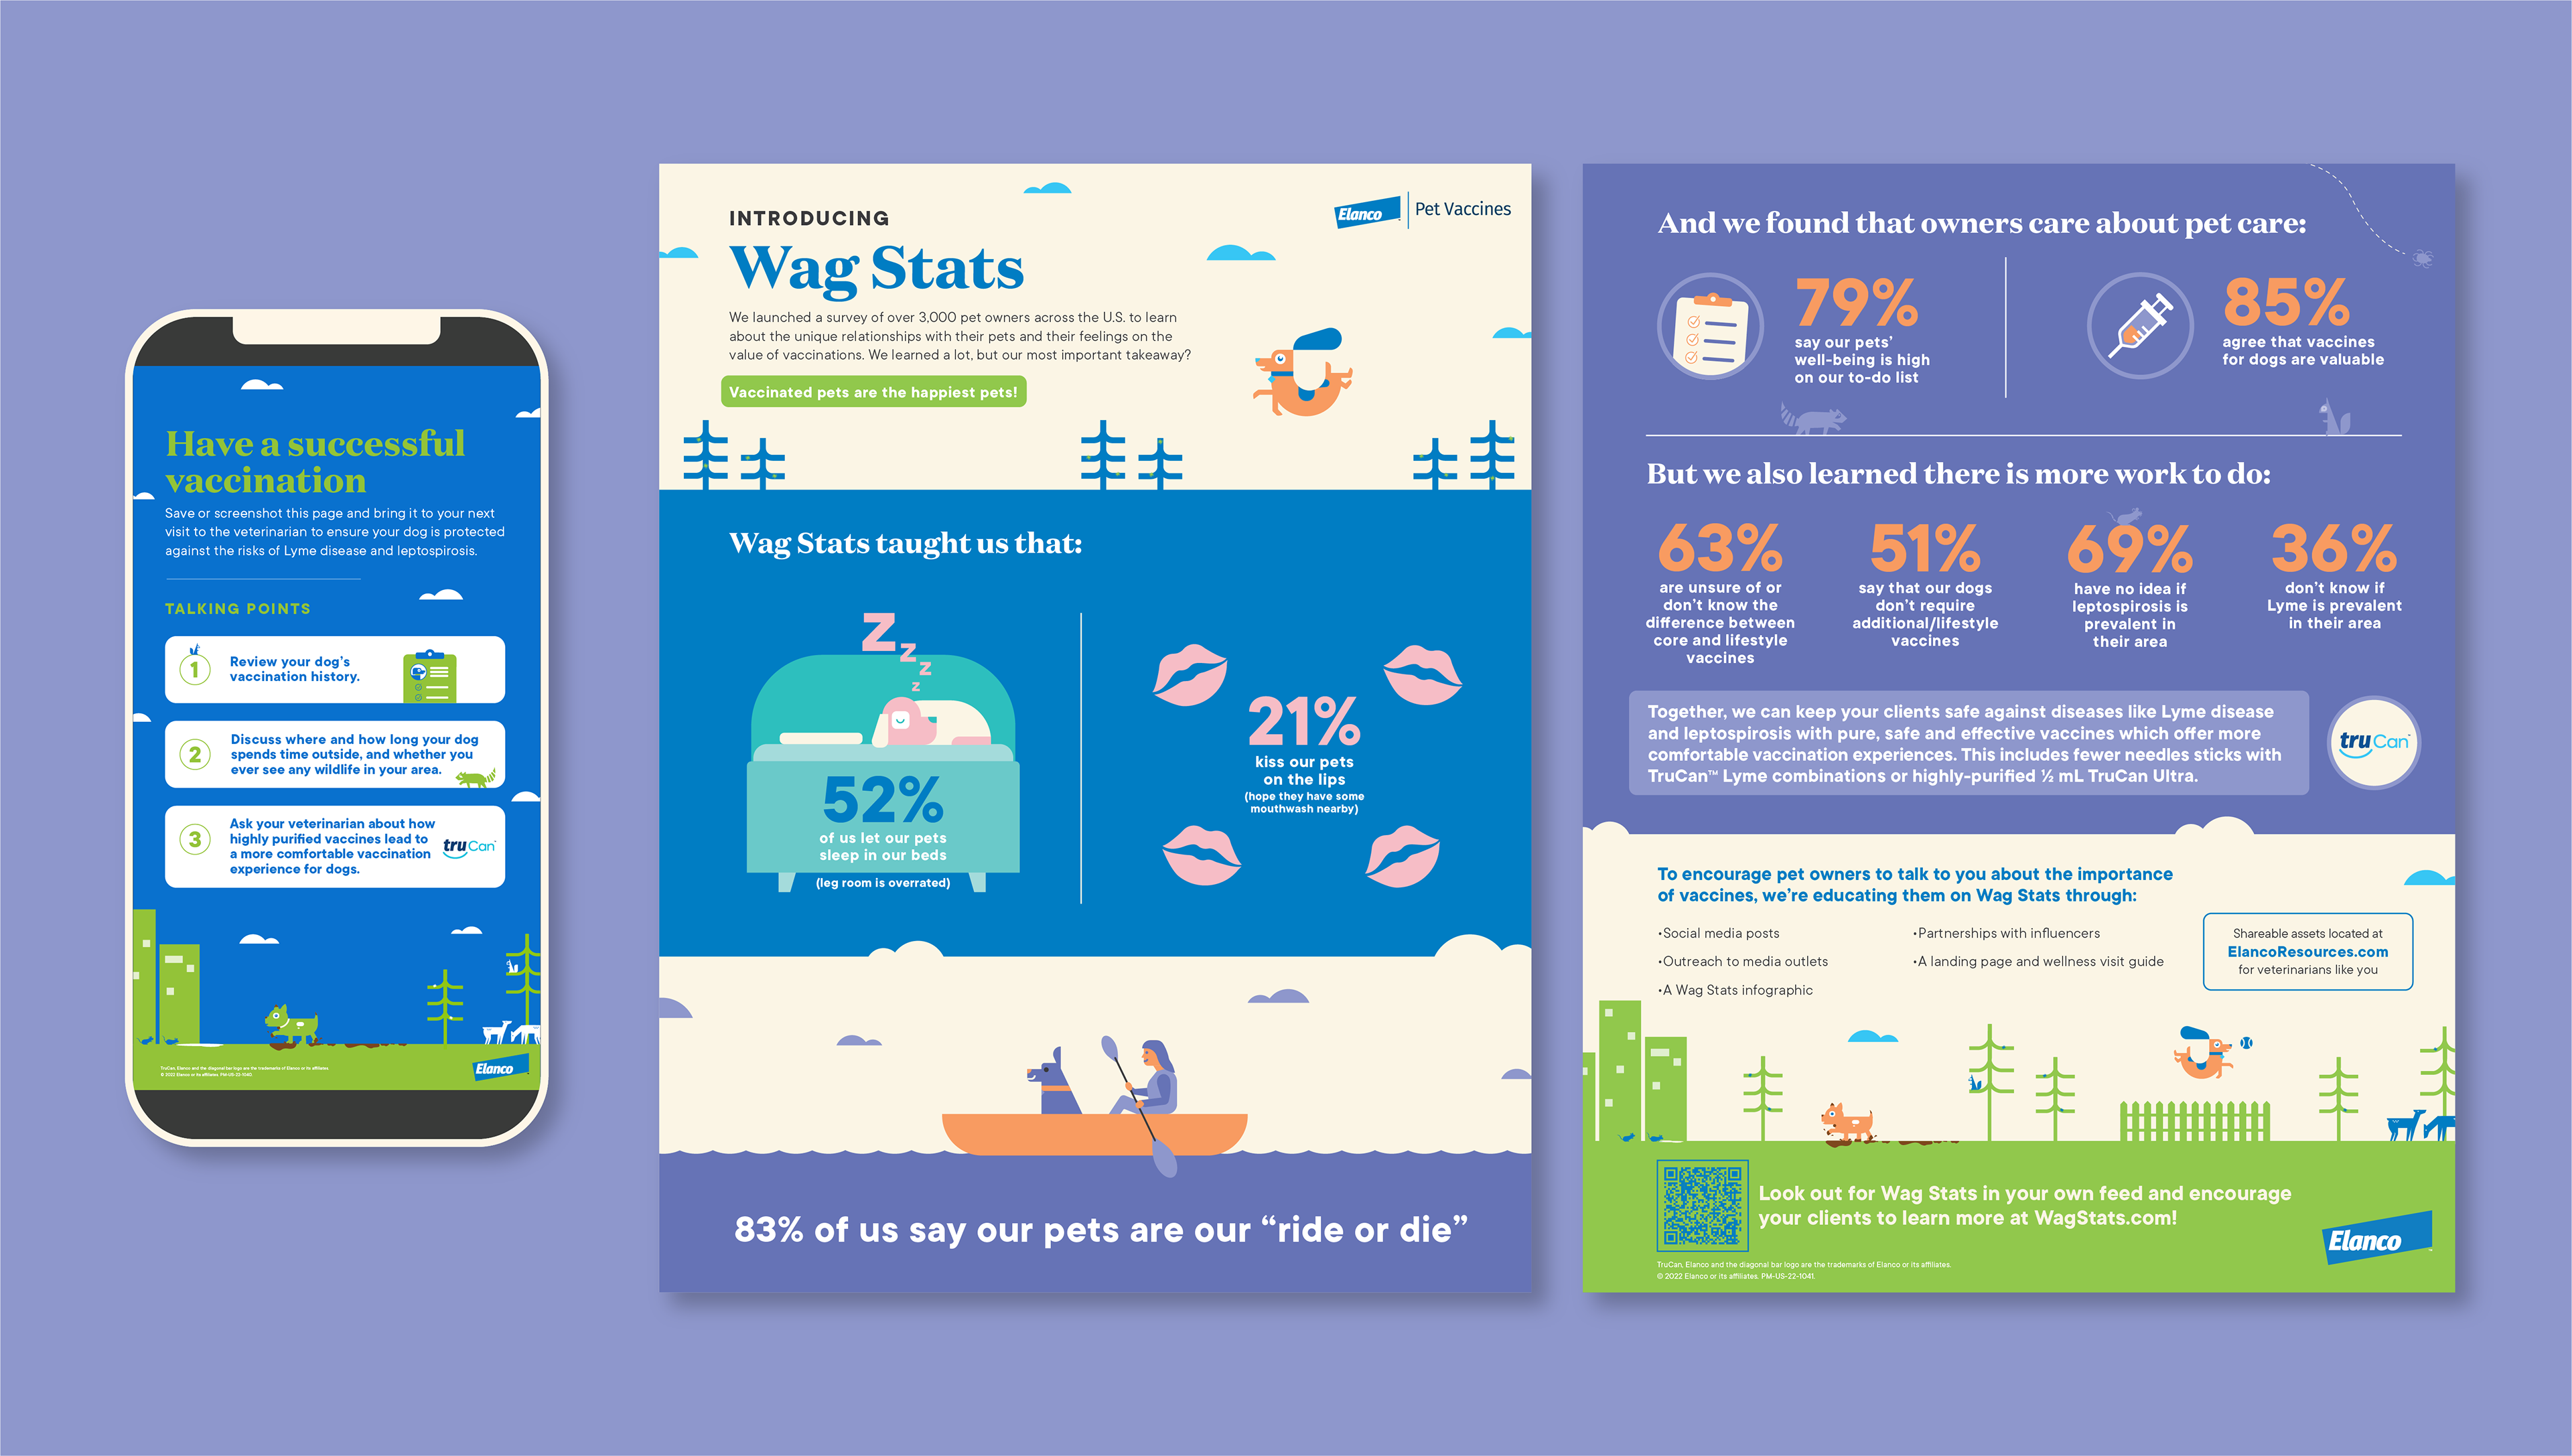
We defined a a color palette system and leveraged the illustration style that has been used in past Elanco work to create fun illustrations that aligned with our stats. From there, we crafted an infographic that would not only be our North Star to pull content from to create supporting assets, but also tell the full Wag Stats story.
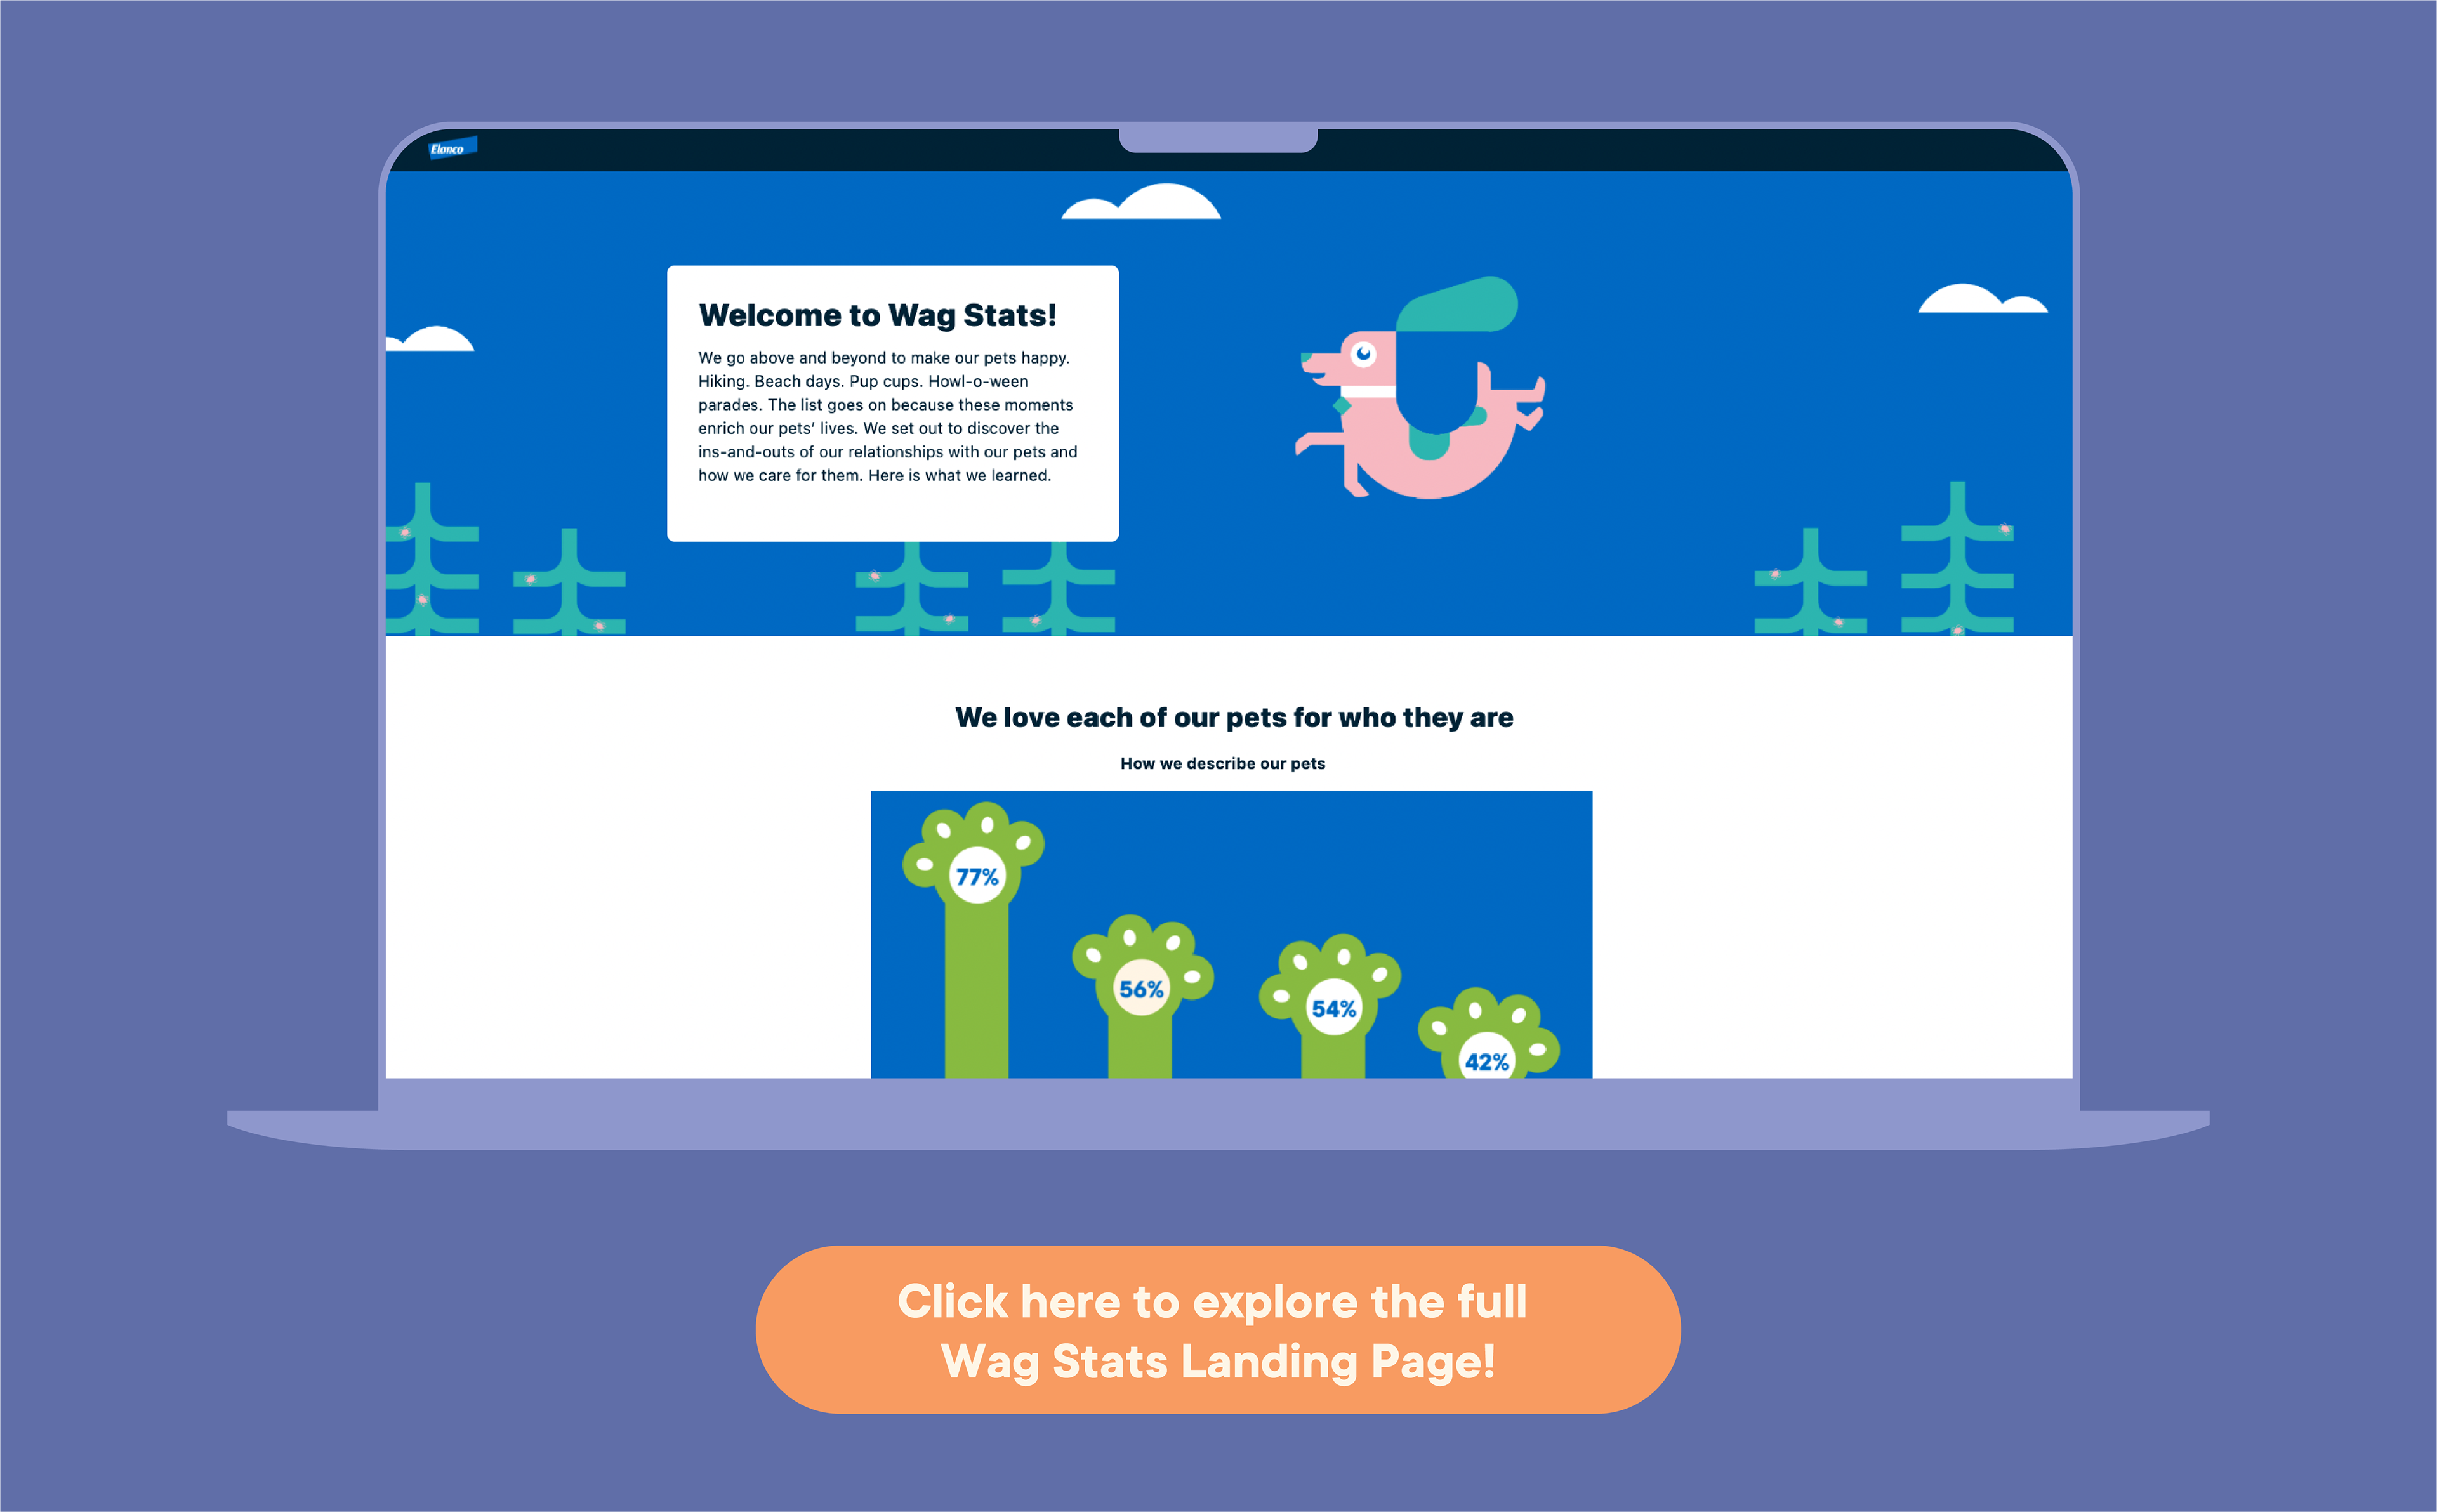
Next, we needed a Landing Page that our assets lead to. The Landing Page tells the same story as the full infographic, but in a more succinct way and ends with action items that pet owners can take to help protect against Lyme and lepto.
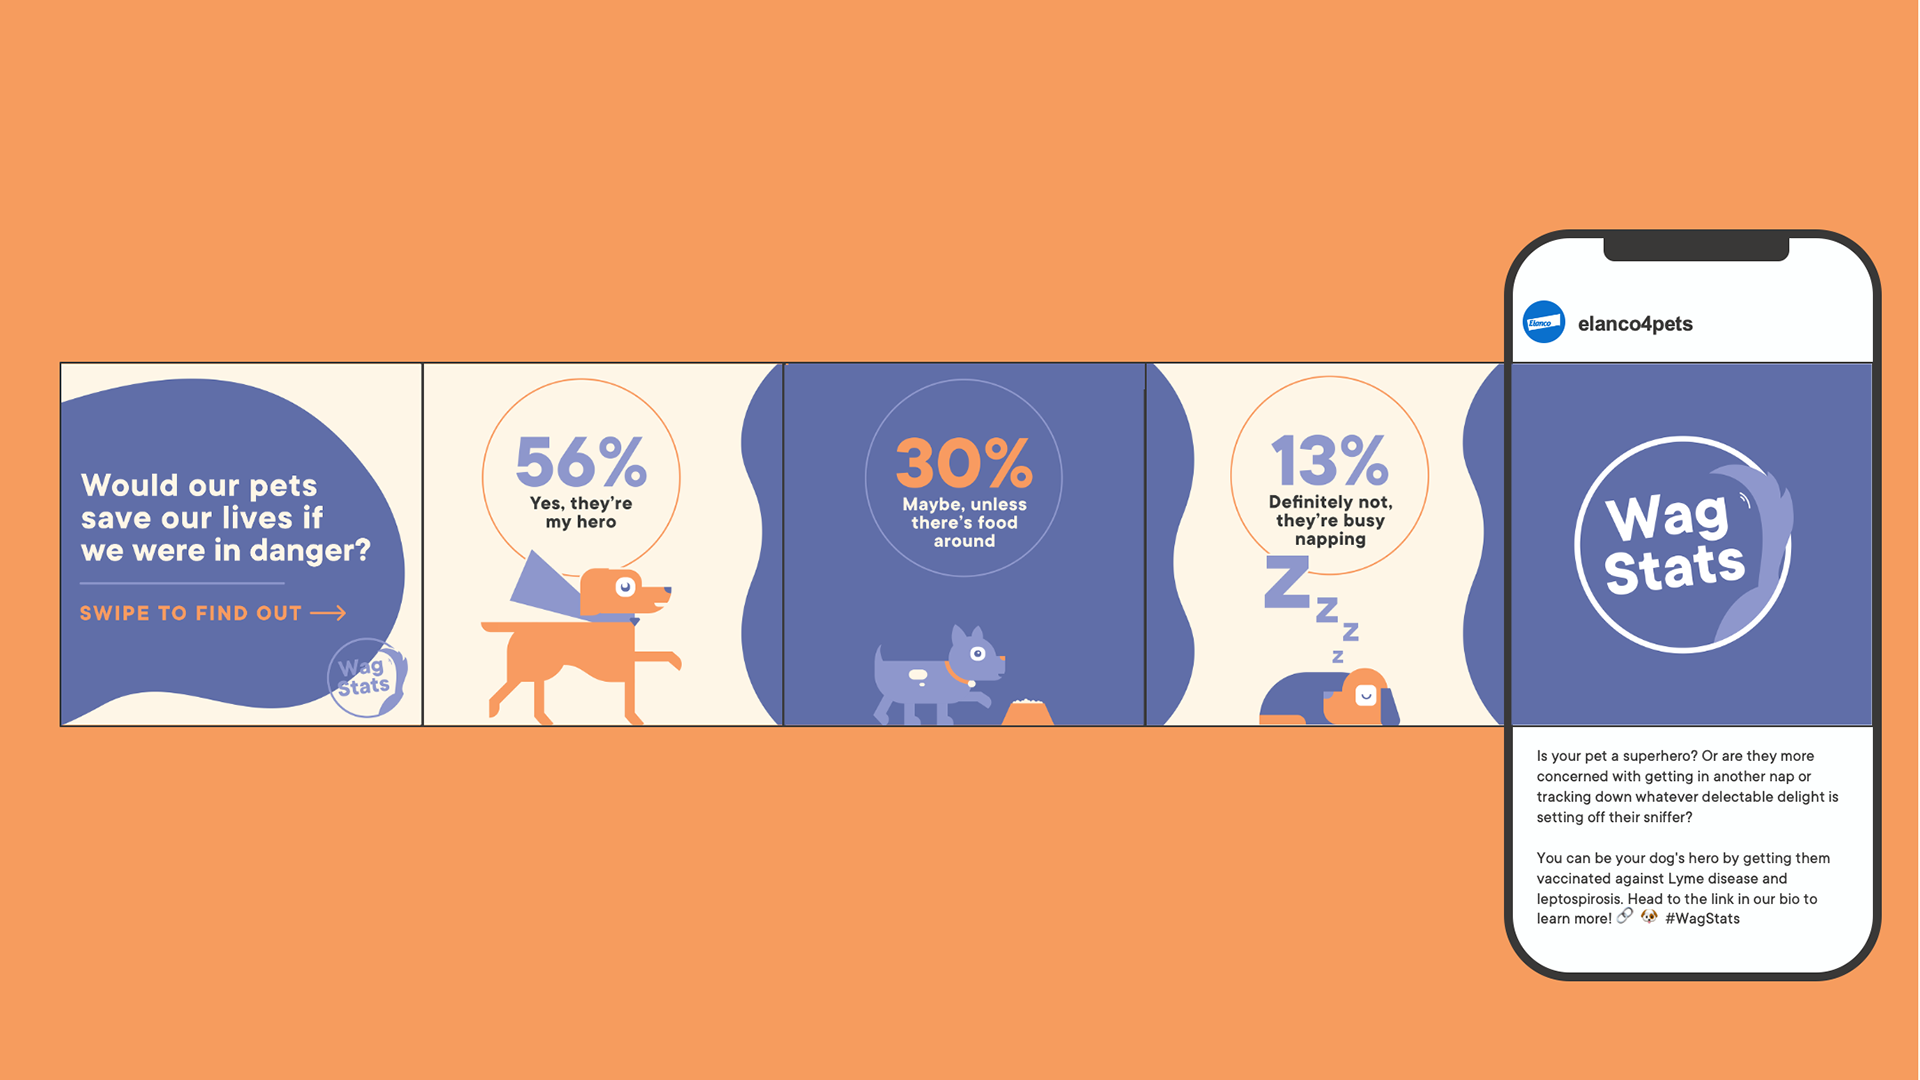
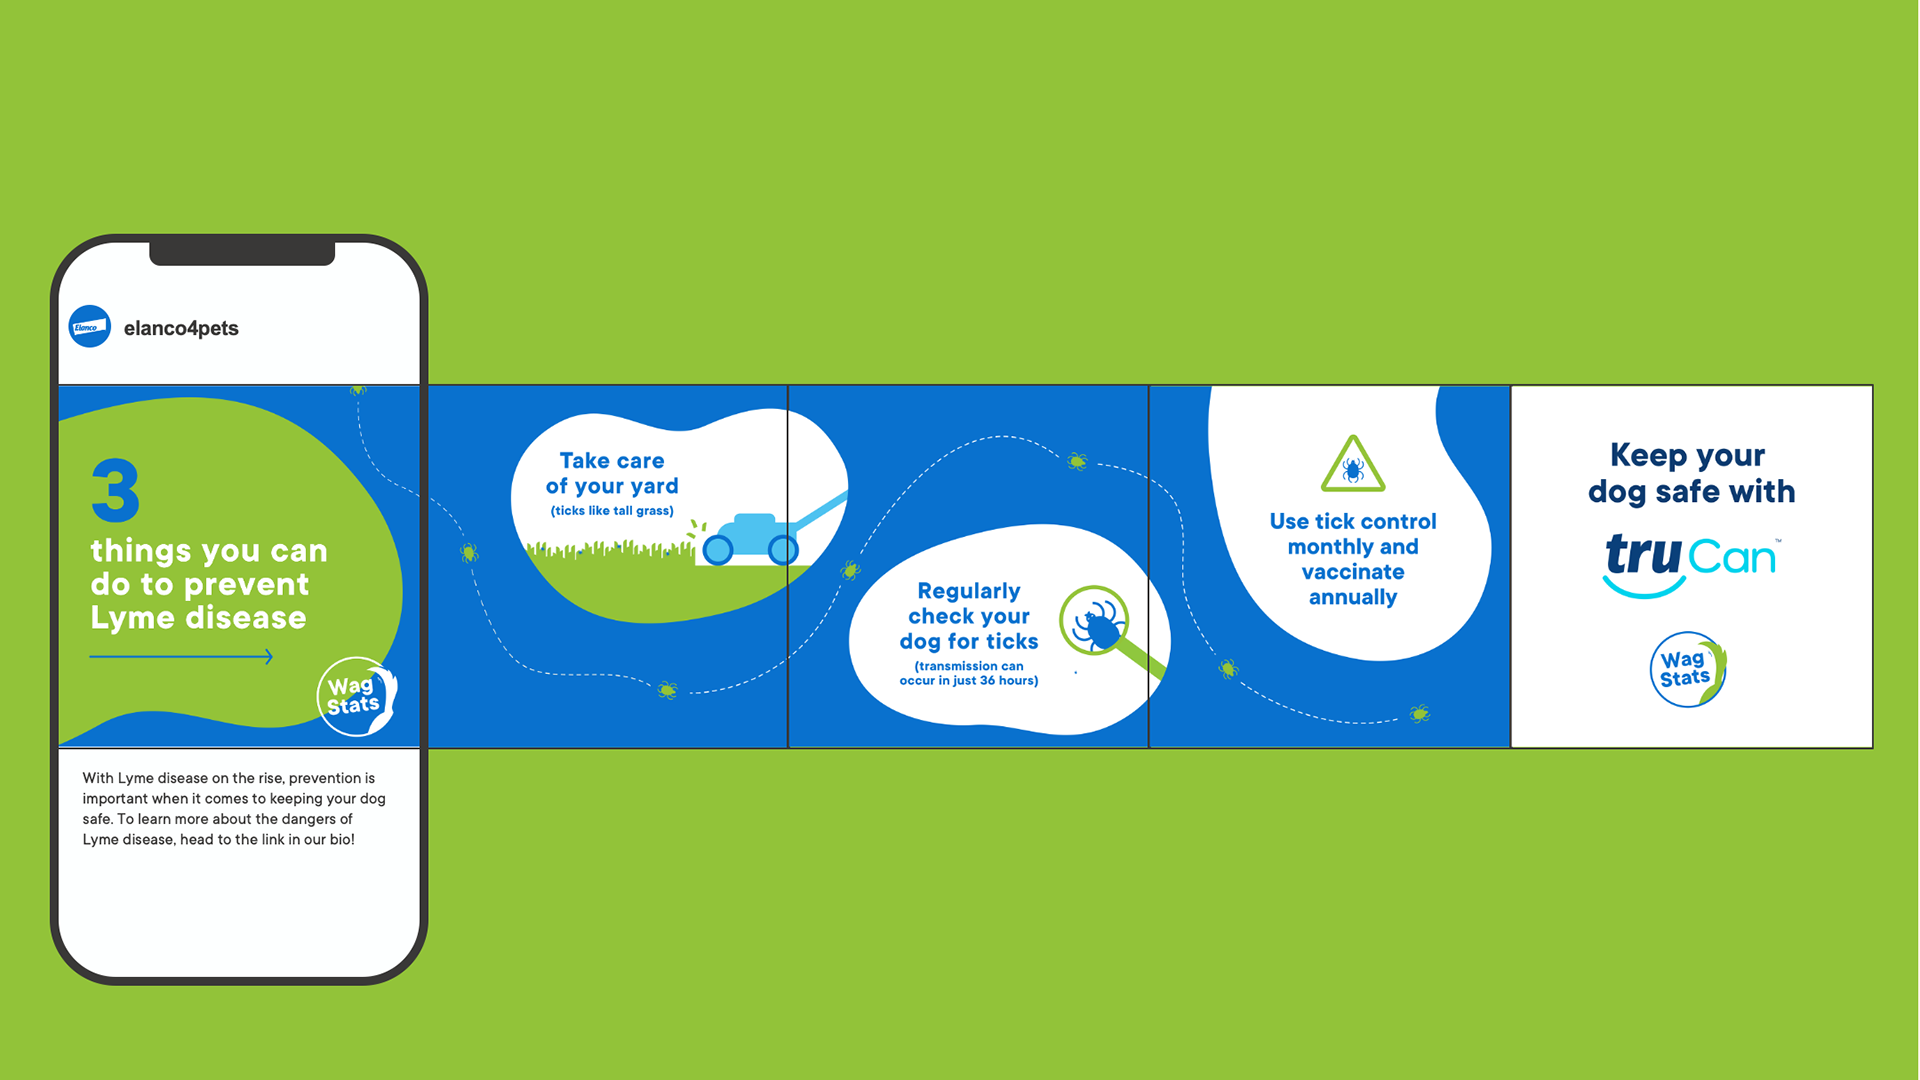
Now that we have both an infographic and a Landing Page, we needed a way to get the word out. What better way to spread the word than social media? We were able to repurpose our illustrations and stats from the infographic and not only apply them to static social carousels, posts and stories, but we also added some eye-catching animations to draw pet owners in.
Once the word is out, we wanted to equip both pet owners and veterinarians with a couple of tools to work together to educate and inform about the Wag Stats mission and the dangers of Lyme and lepto. These tools include a graphic with conversation starters that pet owners can screenshot and bring to their next vet visit and a double-sided Wag Stats information sheet to ensure that the veterinarians are in the loop about Wag Stats!
Overall, we all want what is best for our pets!